Note
Go to the end to download the full example code.
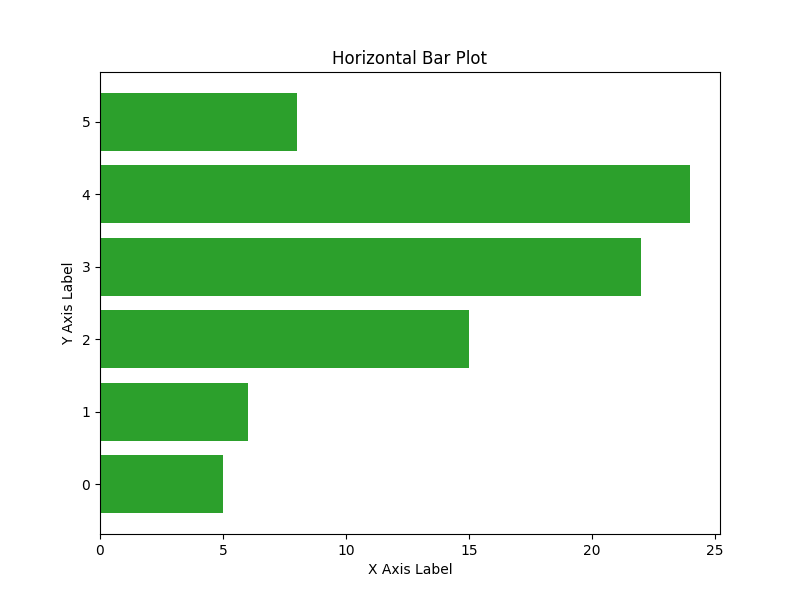
Horizontal Bar Plot#
Below is an example of how to plot a horizontal bar plot using EMCPy’s plotting method.
import numpy as np
import matplotlib.pyplot as plt

from emcpy.plots.plots import HorizontalBar
from emcpy.plots.create_plots import CreatePlot, CreateFigure


def main():
    # Create horizontal bar plot

    # Grab sample bar plot data
    y_pos, widths = _getBarData()

    # Create horizontal bar plot object
    bar = HorizontalBar(y_pos, widths)
    bar.color = 'tab:green'

    # Create plot object and add features
    plot1 = CreatePlot()
    plot1.plot_layers = [bar]
    plot1.add_xlabel(xlabel='X Axis Label')
    plot1.add_ylabel(ylabel='Y Axis Label')
    plot1.add_title("Horizontal Bar Plot")

    # Create figure
    fig = CreateFigure()
    fig.plot_list = [plot1]
    fig.create_figure()

    plt.show()


def _getBarData():
    # Generate test data for bar graphs

    x = ['a', 'b', 'c', 'd', 'e', 'f']
    heights = [5, 6, 15, 22, 24, 8]

    x_pos = [i for i, _ in enumerate(x)]

    return x_pos, heights


if __name__ == '__main__':
    main()
Total running time of the script: (0 minutes 0.047 seconds)