Examples#
The following examples show off the functionality of EMCPy. The examples give reference to what can be done with these collection of tools. Please do not hesitate to issue a pull request to add further examples!
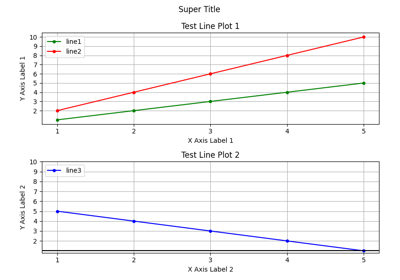
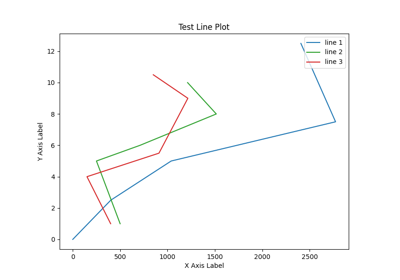
Line Plots#


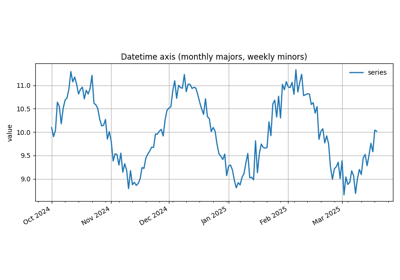
Datetime axis with monthly majors and weekly minors
Datetime axis with monthly majors and weekly minors
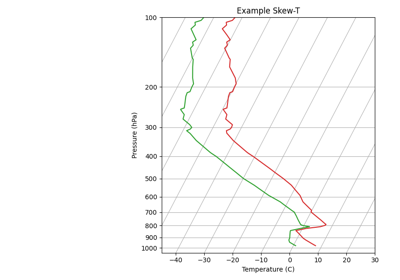
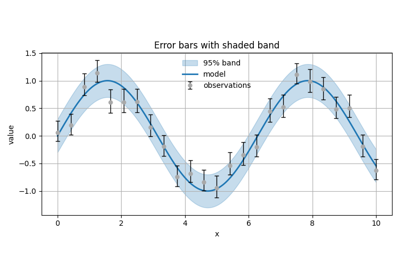
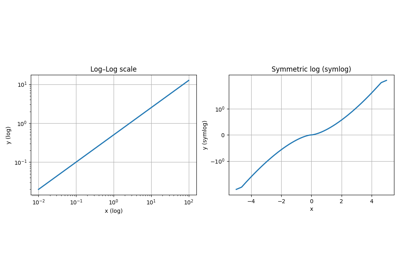
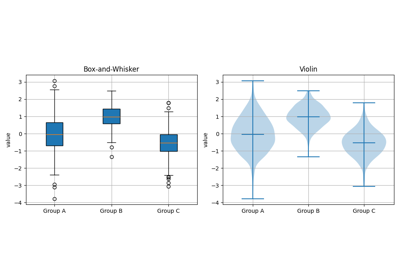
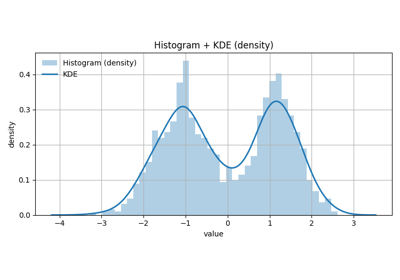
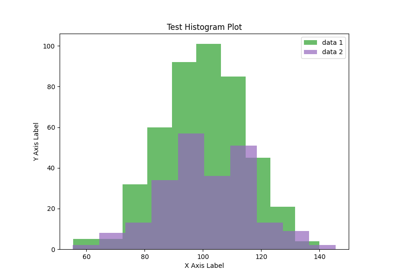
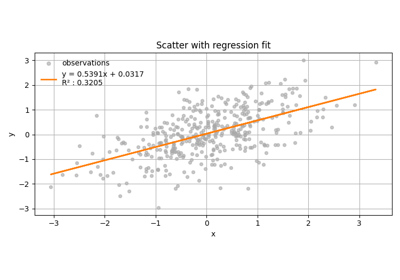
Statistical Plots#

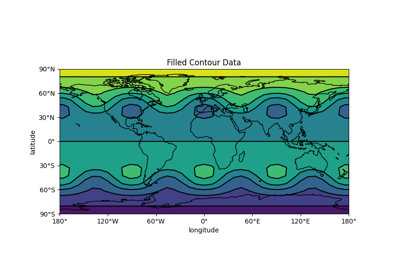
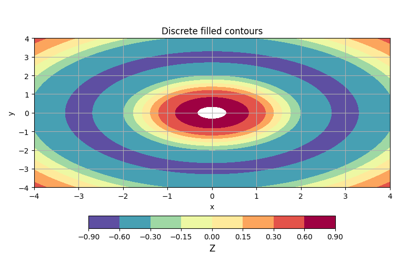
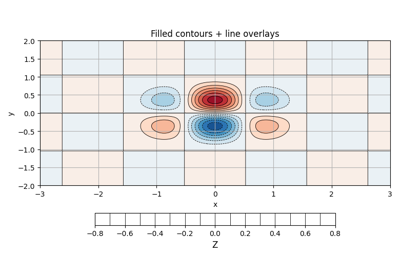
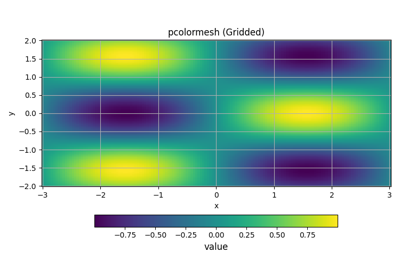
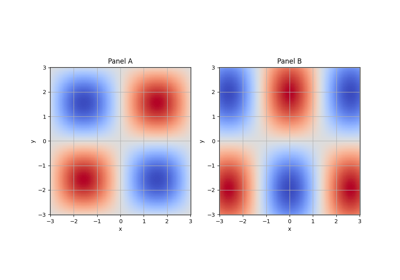
Gridded Plots#
Discrete fields GriddedPlot, Contour, and Contourf support integer_field=True. See note in Explanations.
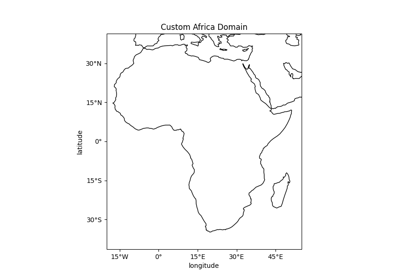
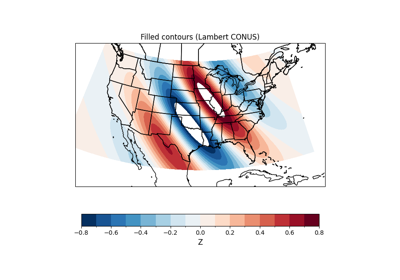
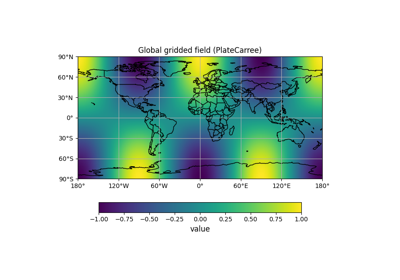
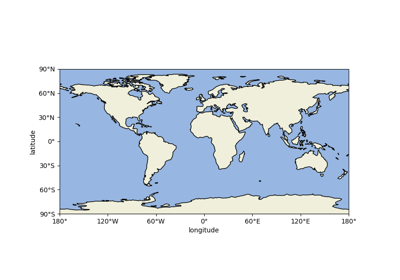
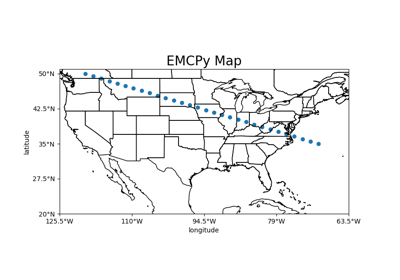
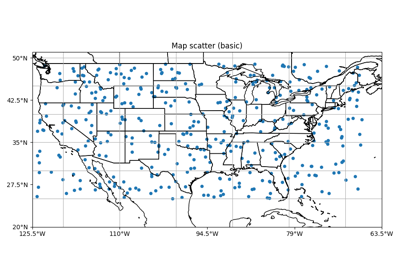
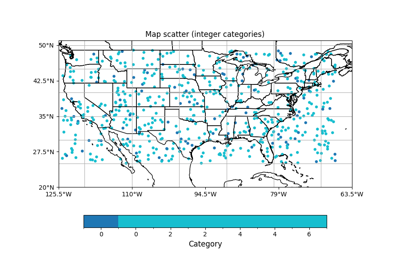
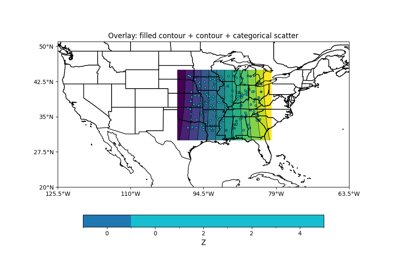
Map Plots#
Discrete fields in MapGridded and MapScatter support integer_field=True. See note in Explanations.