Note
Go to the end to download the full example code.
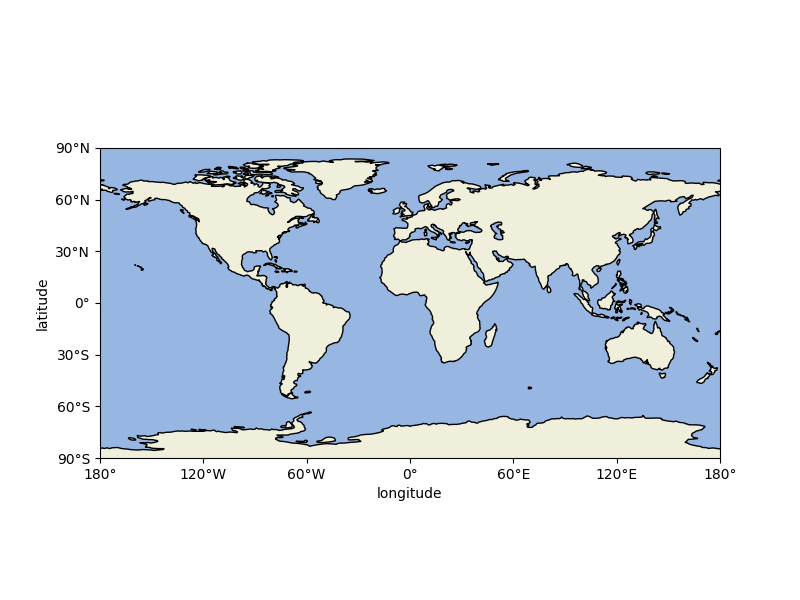
Creating a map plot with no data#
The following example shows how to use the map features in EMCPy. The map feature underlying source code comes from Cartopy.
import matplotlib.pyplot as plt
from emcpy.plots import CreatePlot, CreateFigure
from emcpy.plots.map_tools import Domain, MapProjection


def main():
    # Create global map with no data using
    # PlateCarree projection and coastlines
    plot1 = CreatePlot()
    plot1.projection = 'plcarr'
    plot1.domain = 'global'
    plot1.add_map_features(['coastline', 'land', 'ocean'])
    plot1.add_xlabel(xlabel='longitude')
    plot1.add_ylabel(ylabel='latitude')

    fig = CreateFigure()
    fig.plot_list = [plot1]
    fig.create_figure()

    plt.show()


if __name__ == '__main__':
    main()
Total running time of the script: (0 minutes 0.523 seconds)