Note
Go to the end to download the full example code.
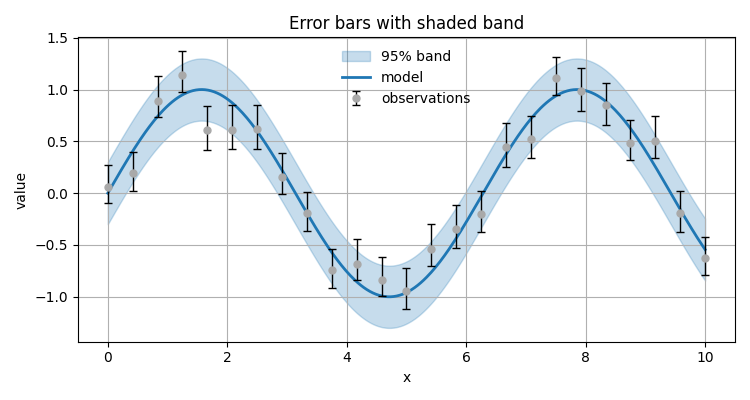
Error bars & shaded confidence band#
Shaded 95% band plus asymmetric error bars — implemented with EMCPy layers only (FillBetween, LinePlot, ErrorBar).
import numpy as np
import matplotlib.pyplot as plt

from emcpy.plots.plots import LinePlot, FillBetween, ErrorBar
from emcpy.plots.create_plots import CreatePlot, CreateFigure

rng = np.random.default_rng(42)
x = np.linspace(0, 10, 25)
y_obs = np.sin(x) + 0.2*rng.standard_normal(x.size)

# Smooth model & band
xx = np.linspace(0, 10, 400)
y_model = np.sin(xx)
band = 0.3
err_lo = 0.15 + 0.05*rng.random(x.size)
err_hi = 0.20 + 0.05*rng.random(x.size)

p = CreatePlot()
layers = []

# Shaded confidence band
fb = FillBetween(xx, y_model - band, y_model + band)
fb.alpha = 0.25
fb.label = "95% band"
layers.append(fb)

# Model line
lp = LinePlot(xx, y_model)
lp.linewidth = 2
lp.label = "model"
layers.append(lp)

# Observations with asymmetric error bars
eb = ErrorBar(x, y_obs)
eb.yerr = [err_lo, err_hi]
eb.fmt = "o"
eb.capsize = 3
eb.label = "observations"
layers.append(eb)


p.plot_layers = layers
p.add_title("Error bars with shaded band")
p.add_xlabel("x")
p.add_ylabel("value")
p.add_grid()
p.add_legend(loc="upper center", frameon=False)

fig = CreateFigure(nrows=1, ncols=1, figsize=(7.5, 4))
fig.plot_list = [p]
fig.create_figure()
fig.tight_layout()
plt.show()
Total running time of the script: (0 minutes 0.085 seconds)