Note
Go to the end to download the full example code.
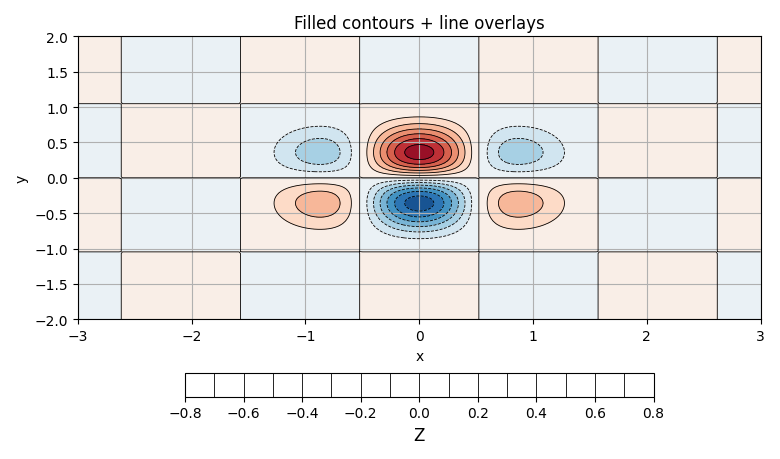
Filled contours with line overlays#
Discrete filled contours with contour-line overlays sharing the same levels.
import numpy as np
import matplotlib.pyplot as plt

from emcpy.plots.plots import FilledContourPlot, ContourPlot
from emcpy.plots.create_plots import CreatePlot, CreateFigure

x = np.linspace(-3, 3, 200)
y = np.linspace(-2, 2, 160)
X, Y = np.meshgrid(x, y)
Z = np.exp(-(X**2 + (Y*1.5)**2)) * np.cos(3*X) * np.sin(3*Y)

levels = np.linspace(-0.8, 0.8, 17)

p = CreatePlot()

cf = FilledContourPlot(X, Y, Z)
cf.levels = levels
cf.cmap = "RdBu_r"
p.plot_layers = [cf]

cl = ContourPlot(X, Y, Z)
cl.levels = levels
cl.colors = "k"
cl.linewidths = 0.6
p.plot_layers.append(cl)

p.add_title("Filled contours + line overlays")
p.add_xlabel("x")
p.add_ylabel("y")
p.add_grid()
p.add_colorbar(label="Z")

fig = CreateFigure(nrows=1, ncols=1, figsize=(7.8, 4.6))
fig.plot_list = [p]
fig.create_figure()
fig.tight_layout()
plt.show()
Total running time of the script: (0 minutes 0.129 seconds)