Note
Go to the end to download the full example code.
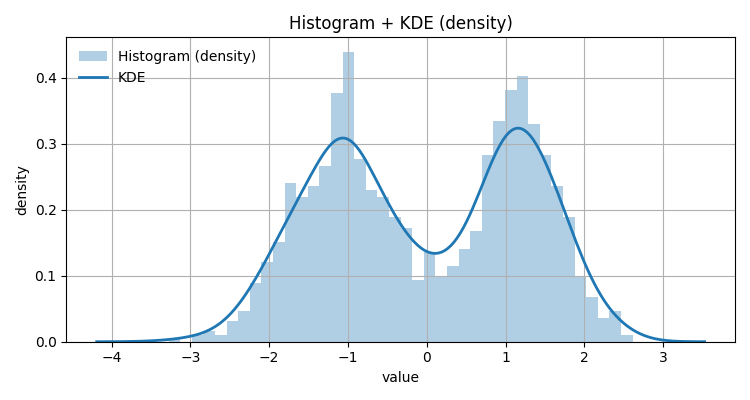
Histogram with KDE Overlay#
Show a normalized histogram with a smooth KDE overlay.
import numpy as np
import matplotlib.pyplot as plt

from emcpy.plots.plots import Histogram, Density
from emcpy.plots.create_plots import CreatePlot, CreateFigure

rng = np.random.default_rng(7)
data = np.concatenate([
    rng.normal(-1.0, 0.7, 700),
    rng.normal(1.2, 0.5, 600)
])

p = CreatePlot()

# Histogram (normalized) as bars
hist = Histogram(data)
hist.bins = 40
hist.density = True
hist.alpha = 0.35
hist.label = "Histogram (density)"
p.plot_layers = [hist]

# KDE overlay via EMCPy Density layer (uses seaborn under the hood)
kde = Density(data)
kde.label = "KDE"
kde.linewidth = 2
p.plot_layers.append(kde)

p.add_title("Histogram + KDE (density)")
p.add_xlabel("value")
p.add_ylabel("density")
p.add_grid()
p.add_legend(loc="upper left", frameon=False)

fig = CreateFigure(nrows=1, ncols=1, figsize=(7.5, 4))
fig.plot_list = [p]
fig.create_figure()
fig.tight_layout()
plt.show()
Total running time of the script: (0 minutes 0.138 seconds)