Note
Go to the end to download the full example code.
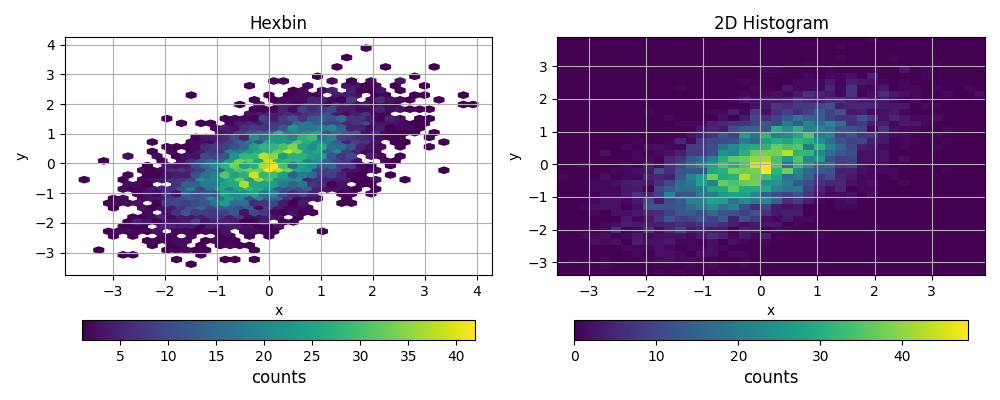
Hexbin vs 2D Histogram with Colorbars#
Two dense 2D binning approaches with per-axes colorbars.
import numpy as np
import matplotlib.pyplot as plt

from emcpy.plots.plots import HexBin, Hist2D
from emcpy.plots.create_plots import CreatePlot, CreateFigure

rng = np.random.default_rng(1)
n = 6000
x = rng.normal(size=n)
y = 0.6 * x + rng.normal(scale=0.8, size=n)

# Left: hexbin
p_left = CreatePlot()
hb = HexBin(x, y)
hb.gridsize = 40
hb.mincnt = 1

p_left.plot_layers = [hb]
p_left.add_title("Hexbin")
p_left.add_xlabel("x")
p_left.add_ylabel("y")
p_left.add_grid()
p_left.add_colorbar(label="counts")        # EMCPy per-axes colorbar

# Right: hist2d
p_right = CreatePlot()
h2 = Hist2D(x, y)
h2.bins = 40
p_right.plot_layers = [h2]
p_right.add_title("2D Histogram")
p_right.add_xlabel("x")
p_right.add_ylabel("y")
p_right.add_grid()
p_right.add_colorbar(label="counts")

fig = CreateFigure(nrows=1, ncols=2, figsize=(10, 4))
fig.plot_list = [p_left, p_right]
fig.create_figure()
fig.tight_layout()
plt.show()
Total running time of the script: (0 minutes 0.202 seconds)