Note
Go to the end to download the full example code.
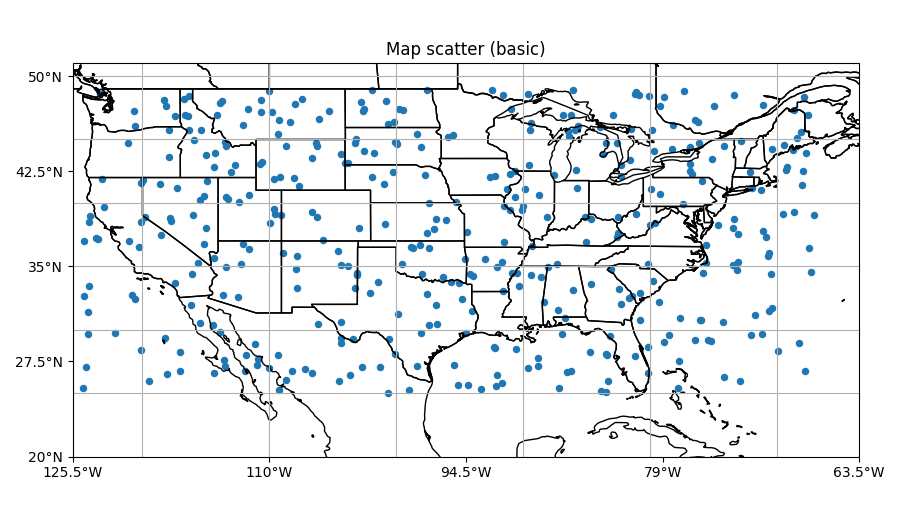
Map scatter (basic)#
Unlabeled points (solid color) over the CONUS domain.
import numpy as np
from emcpy.plots.map_plots import MapScatter
from emcpy.plots.create_plots import CreatePlot, CreateFigure

rng = np.random.default_rng(0)
n = 400
lat = rng.uniform(25, 49, n)
lon = rng.uniform(-125, -67, n)

p = CreatePlot(projection="plcarr", domain="conus")
ms = MapScatter(lat, lon)              # data=None -> solid color points
ms.color = "tab:blue"
ms.markersize = 15

p.plot_layers = [ms]
p.add_map_features(["states", "coastline", "borders"])
p.add_title("Map scatter (basic)")
p.add_grid()

fig = CreateFigure(1, 1, figsize=(9, 5.2))
fig.plot_list = [p]
fig.create_figure()
fig.tight_layout()
Total running time of the script: (0 minutes 0.144 seconds)