Note
Go to the end to download the full example code.
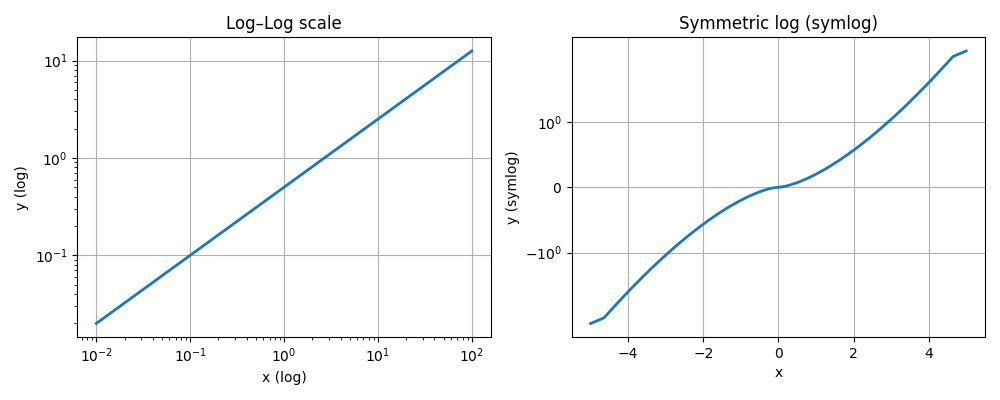
Log and symlog scales#
Left: log–log scaling. Right: symmetric log (symlog) for data crossing zero. All axis scaling done via EMCPy helpers.
import numpy as np
import matplotlib.pyplot as plt

from emcpy.plots.plots import LinePlot
from emcpy.plots.create_plots import CreatePlot, CreateFigure

# --- Left panel: log–log ---
x = np.logspace(-2, 2, 200)
y = 0.5 * x**0.7

p_left = CreatePlot()
lp = LinePlot(x, y)
lp.linewidth = 2
p_left.plot_layers = [lp]
p_left.add_title("Log–Log scale")
p_left.add_xlabel("x (log)")
p_left.add_ylabel("y (log)")
p_left.add_grid()
p_left.set_xscale("log")
p_left.set_yscale("log")


# --- Right panel: symlog (safe fractional power) ---
def signed_pow(a, p):
    a = np.asarray(a)
    return np.sign(a) * (np.abs(a) ** p)


xs = np.linspace(-5, 5, 400)
ys = signed_pow(xs, 1.5) / 5

p_right = CreatePlot()
lp = LinePlot(xs, ys)
lp.linewidth = 2
p_right.plot_layers = [lp]
p_right.add_title("Symmetric log (symlog)")
p_right.add_xlabel("x")
p_right.add_ylabel("y (symlog)")
p_right.add_grid()
p_right.set_yscale("symlog")

fig = CreateFigure(nrows=1, ncols=2, figsize=(10, 4))
fig.plot_list = [p_left, p_right]
fig.create_figure()
fig.tight_layout()
plt.show()
Total running time of the script: (0 minutes 0.295 seconds)