Note
Go to the end to download the full example code.
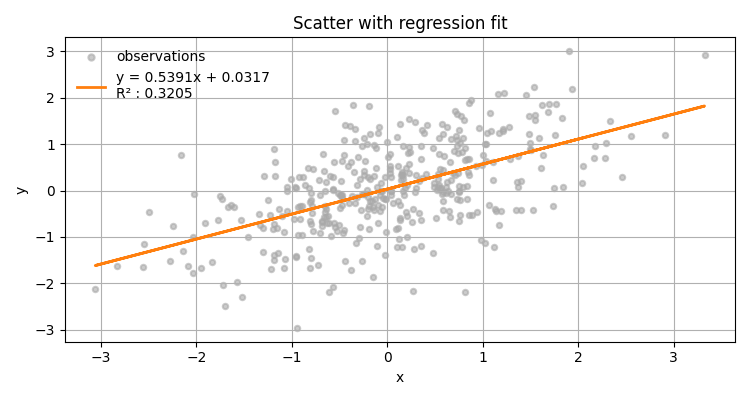
Scatter with Linear Regression Fit#
Plot points and automatically add a regression line with R², slope, intercept.
import numpy as np
import matplotlib.pyplot as plt

from emcpy.plots.plots import Scatter
from emcpy.plots.create_plots import CreatePlot, CreateFigure

rng = np.random.default_rng(3)
x = rng.normal(0, 1, 400)
y = 0.6 * x + rng.normal(0, 0.8, 400)

p = CreatePlot()

sc = Scatter(x, y)
sc.markersize = 15
sc.alpha = 0.6
sc.label = "observations"
sc.do_linear_regression = True
sc.linear_regression = {"linewidth": 2, "color": "tab:orange"}  # style for the fit line
p.plot_layers = [sc]

p.add_title("Scatter with regression fit")
p.add_xlabel("x")
p.add_ylabel("y")
p.add_grid()
p.add_legend(loc="upper left", frameon=False)

fig = CreateFigure(nrows=1, ncols=1, figsize=(7.5, 4))
fig.plot_list = [p]
fig.create_figure()
fig.tight_layout()
plt.show()
Total running time of the script: (0 minutes 0.090 seconds)