Note
Go to the end to download the full example code.
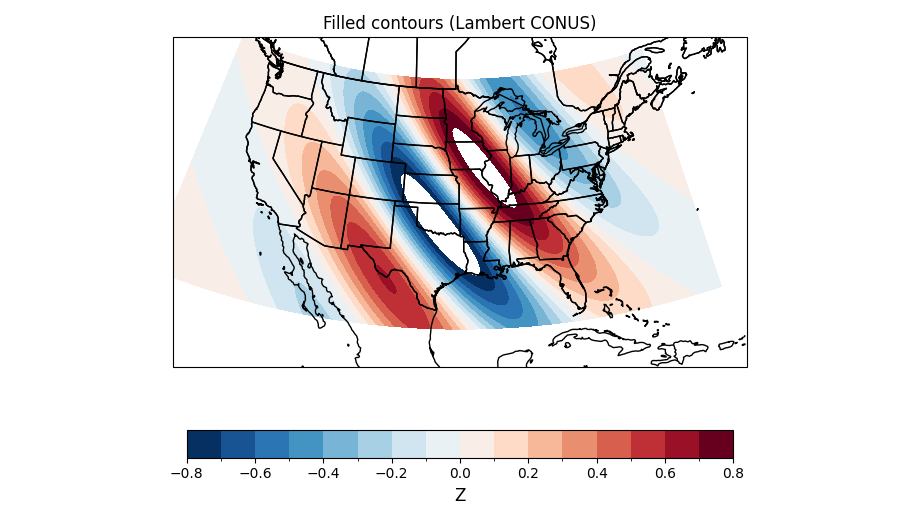
Filled contours (Lambert CONUS)#
Lambert Conformal over CONUS. Centers are forwarded from the domain, so no extra setup needed.
import numpy as np
from emcpy.plots.map_plots import MapFilledContour
from emcpy.plots.create_plots import CreatePlot, CreateFigure

lon = np.linspace(-130, -65, 261)
lat = np.linspace(24, 50, 131)
LON, LAT = np.meshgrid(lon, lat)

Z = np.exp(-((LON + 95) ** 2 + (LAT - 37) ** 2) / (2 * 12 ** 2)) * np.cos(0.25 * (LON + LAT))

p = CreatePlot(projection="lambert", domain="conus")
cf = MapFilledContour(LAT, LON, Z)
cf.cmap = "RdBu_r"
cf.levels = np.linspace(-0.8, 0.8, 17)

p.plot_layers = [cf]
p.add_map_features(["states", "coastline", "borders"])
p.add_colorbar(label="Z")
p.add_title("Filled contours (Lambert CONUS)")

fig = CreateFigure(1, 1, figsize=(9.2, 5.2))
fig.plot_list = [p]
fig.create_figure()
fig.tight_layout()
Total running time of the script: (0 minutes 2.302 seconds)