Note
Go to the end to download the full example code.
Plotting multiple lines on a single plot#
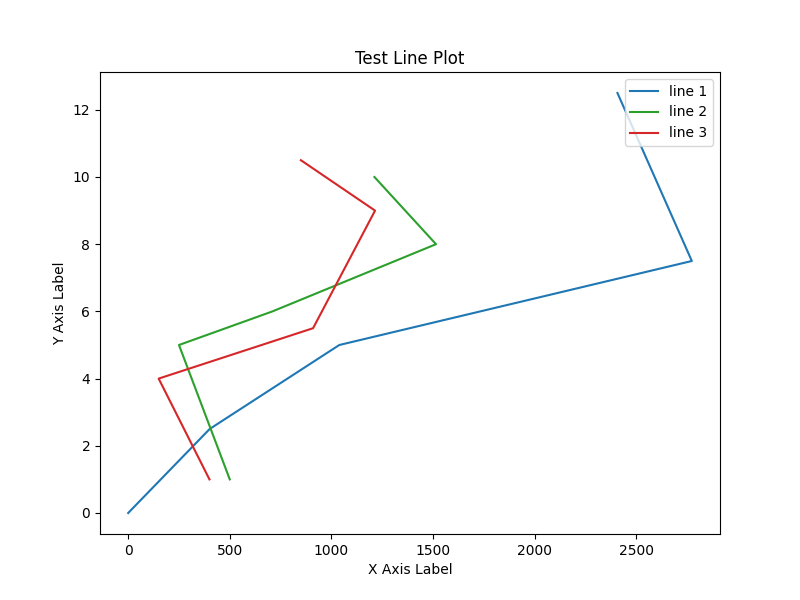
The following example shows how to use EMCPy’s method to plot several lines on a single subplot. The user creates three separate objects using different data and plots them on the same layer.
import numpy as np
import matplotlib.pyplot as plt

from emcpy.plots.plots import LinePlot
from emcpy.plots.create_plots import CreatePlot, CreateFigure


def _getLineData():
    # generate test data for line plots

    x1 = [0, 401, 1039, 2774, 2408]
    x2 = [500, 250, 710, 1515, 1212]
    x3 = [400, 150, 910, 1215, 850]
    y1 = [0, 2.5, 5, 7.5, 12.5]
    y2 = [1, 5, 6, 8, 10]
    y3 = [1, 4, 5.5, 9, 10.5]

    return x1, y1, x2, y2, x3, y3


def main():
    # create line plot with multiple lines
    x1, y1, x2, y2, x3, y3 = _getLineData()
    lp1 = LinePlot(x1, y1)
    lp1.label = 'line 1'

    lp2 = LinePlot(x2, y2)
    lp2.color = 'tab:green'
    lp2.label = 'line 2'

    lp3 = LinePlot(x3, y3)
    lp3.color = 'tab:red'
    lp3.label = 'line 3'

    plot1 = CreatePlot()
    plot1.plot_layers = [lp1, lp2, lp3]
    plot1.add_title('Test Line Plot')
    plot1.add_xlabel('X Axis Label')
    plot1.add_ylabel('Y Axis Label')
    plot1.add_legend(loc='upper right')

    fig = CreateFigure()
    fig.plot_list = [plot1]
    fig.create_figure()

    plt.show()


if __name__ == '__main__':
    main()
Total running time of the script: (0 minutes 0.057 seconds)