Note
Go to the end to download the full example code.
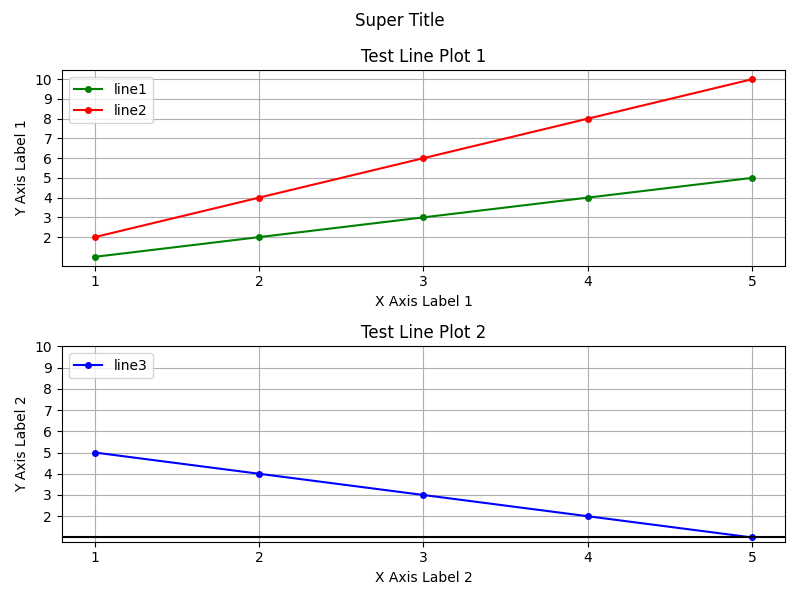
Line Plot Options#
This script shows several examples of the many different line plot options. They follow the same options as matplotlib.
import numpy as np
import matplotlib.pyplot as plt

from emcpy.plots.plots import LinePlot, HorizontalLine
from emcpy.plots.create_plots import CreatePlot, CreateFigure


def main():

    x1 = [1, 2, 3, 4, 5]
    y1 = [1, 2, 3, 4, 5]
    x2 = [1, 2, 3, 4, 5]
    y2 = [2, 4, 6, 8, 10]
    x3 = [1, 2, 3, 4, 5]
    y3 = [5, 4, 3, 2, 1]

    # Top plot
    plot1 = CreatePlot()
    plt_list = []
    lp = LinePlot(x1, y1)
    lp.color = "green"
    lp.linestyle = "-"
    lp.linewidth = 1.5
    lp.marker = "o"
    lp.markersize = 4
    lp.alpha = None
    lp.label = "line1"
    plt_list.append(lp)

    lp = LinePlot(x2, y2)
    lp.color = "red"
    lp.linestyle = "-"
    lp.linewidth = 1.5
    lp.marker = "o"
    lp.markersize = 4
    lp.alpha = None
    lp.label = "line2"
    plt_list.append(lp)

    # Bottom plot
    plot2 = CreatePlot()
    plt_list2 = []
    lp = LinePlot(x3, y3)
    lp.color = "blue"
    lp.linestyle = "-"
    lp.linewidth = 1.5
    lp.marker = "o"
    lp.markersize = 4
    lp.alpha = None
    lp.label = "line3"
    plt_list2.append(lp)

    lp = HorizontalLine(1)
    lp.color = "black"
    lp.linestyle = "-"
    lp.linewidth = 1.5
    lp.marker = None
    lp.alpha = None
    lp.label = None
    plt_list2.append(lp)

    plot1.plot_layers = plt_list
    plot2.plot_layers = plt_list2

    # ---------- Plot 1 features ----------
    plot1.add_title(label="Test Line Plot 1")
    plot1.add_xlabel(xlabel="X Axis Label 1")
    plot1.add_ylabel(ylabel="Y Axis Label 1")
    plot1.add_grid()

    plot1.set_xticks(x1)
    plot1.set_xticklabels([str(item) for item in x1], rotation=0)

    # FLAT, 1-D yticks for plot1 (cover y1 and y2 range)
    lo1 = int(np.floor(min(min(y1), min(y2))))
    hi1 = int(np.ceil(max(max(y1), max(y2))))
    yticks1 = list(range(lo1, hi1 + 1))

    plot1.set_yticks(yticks1)
    plot1.set_yticklabels([str(item) for item in yticks1], rotation=0)

    plot1.add_legend(loc="upper left", fancybox=True, framealpha=0.80)

    # ---------- Plot 2 features ----------
    plot2.add_title(label="Test Line Plot 2")
    plot2.add_xlabel(xlabel="X Axis Label 2")
    plot2.add_ylabel(ylabel="Y Axis Label 2")
    plot2.add_grid()

    plot2.set_xticks(x2)
    plot2.set_xticklabels([str(item) for item in x2], rotation=0)

    # FLAT, 1-D yticks for plot2 (cover y3 and the horiz line at 1)
    lo2 = int(np.floor(min(min(y3), 1)))
    hi2 = int(np.ceil(max(max(y3), 1)))
    yticks2 = list(range(lo2, hi2 + 1))

    plot2.set_yticks(yticks2)
    plot2.set_yticklabels([str(item) for item in yticks2], rotation=0)

    plot2.add_legend(loc="upper left", fancybox=True, framealpha=0.80)

    # Return matplotlib figure
    fig = CreateFigure(nrows=2, ncols=1, figsize=(8, 6))
    fig.plot_list = [plot1, plot2]
    fig.create_figure()
    fig.add_suptitle("Super Title")
    fig.tight_layout()

    plt.show()


if __name__ == '__main__':
    main()
Total running time of the script: (0 minutes 0.119 seconds)