Note
Go to the end to download the full example code.
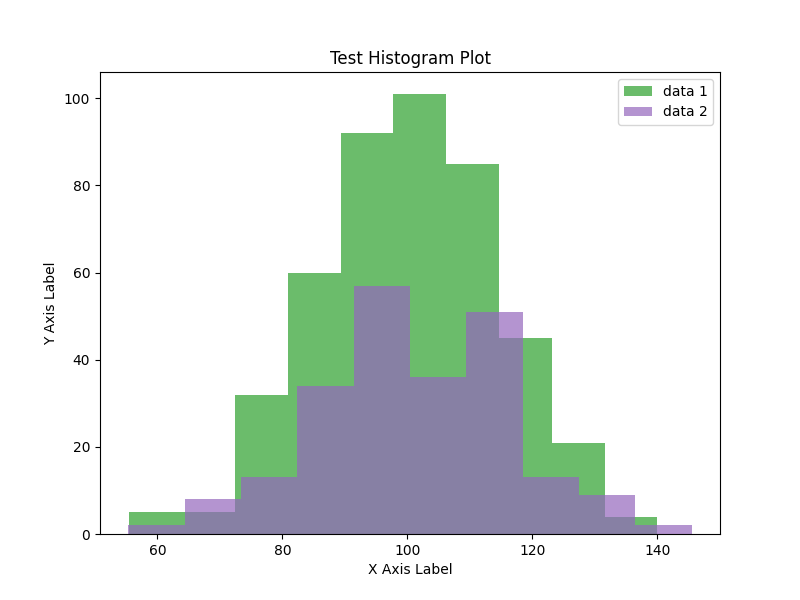
Layered histograms#
This example shows how to plot multiple histograms as layers on single plot.
import numpy as np
import matplotlib.pyplot as plt

from emcpy.plots.plots import Histogram
from emcpy.plots.create_plots import CreatePlot, CreateFigure


def main():
    # Generate test data for histogram plots
    mu = 100  # mean of distribution
    sigma = 15  # standard deviation of distribution
    data1 = mu + sigma * np.random.randn(450)
    data2 = mu + sigma * np.random.randn(225)

    # Create histogram objects
    hst1 = Histogram(data1)
    hst1.color = 'tab:green'
    hst1.alpha = 0.7
    hst1.label = 'data 1'

    hst2 = Histogram(data2)
    hst2.color = 'tab:purple'
    hst2.alpha = 0.7
    hst2.label = 'data 2'

    # Create histogram plot object and add features
    plot1 = CreatePlot()
    plot1.plot_layers = [hst1, hst2]
    plot1.add_title(label='Test Histogram Plot')
    plot1.add_xlabel(xlabel='X Axis Label')
    plot1.add_ylabel(ylabel='Y Axis Label')
    plot1.add_legend()

    # Create figure and save as png
    fig = CreateFigure()
    fig.plot_list = [plot1]
    fig.create_figure()

    plt.show()


if __name__ == '__main__':
    main()
Total running time of the script: (0 minutes 0.073 seconds)