Note
Go to the end to download the full example code.
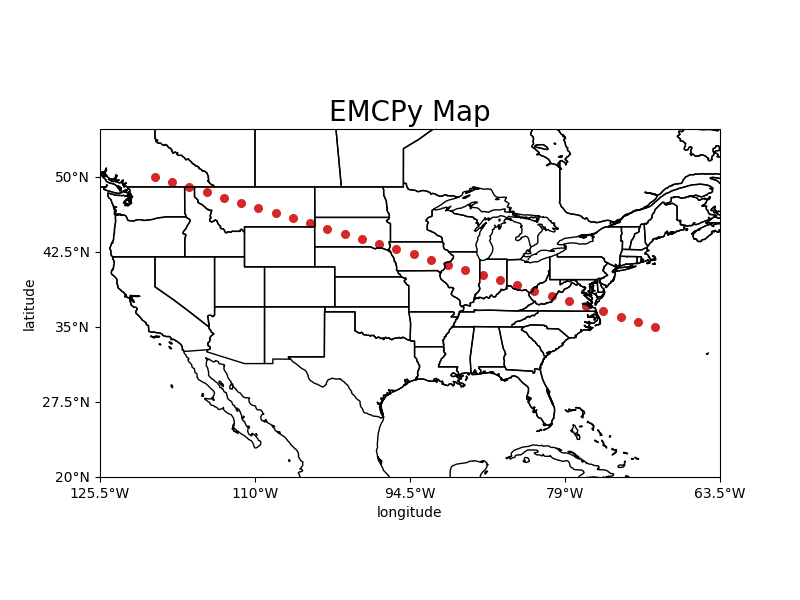
Plotting 2D scatter data on map plot#
Sometimes, users only want to look at the locations of their data on a map and do not care about the actual values. Below is an example of how to just plot lat and lon values on map.
import numpy as np
import matplotlib.pyplot as plt

from emcpy.plots import CreatePlot, CreateFigure
from emcpy.plots.map_tools import Domain, MapProjection
from emcpy.plots.map_plots import MapScatter


def main():
    # Create test data
    lats = np.linspace(35, 50, 30)
    lons = np.linspace(-70, -120, 30)

    # Create scatter plot on CONUS domian
    scatter = MapScatter(lats, lons)
    # change colormap and markersize
    scatter.color = 'tab:red'
    scatter.markersize = 25

    # Create plot object and add features
    plot1 = CreatePlot()
    plot1.plot_layers = [scatter]
    plot1.projection = 'plcarr'
    plot1.domain = 'conus'
    plot1.add_map_features(['coastline', 'states'])
    plot1.add_xlabel(xlabel='longitude')
    plot1.add_ylabel(ylabel='latitude')
    plot1.add_title(label='EMCPy Map', loc='center',
                    fontsize=20)

    fig = CreateFigure()
    fig.plot_list = [plot1]
    fig.create_figure()

    plt.show()


if __name__ == '__main__':
    main()
Total running time of the script: (0 minutes 1.653 seconds)