Note
Go to the end to download the full example code.
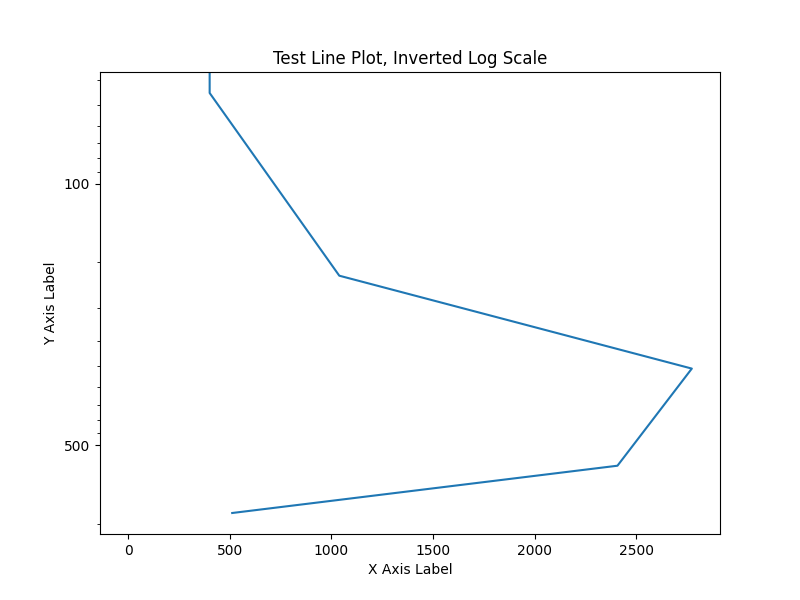
Invert log scale#
This example shows how to create an inverted y-axis that also uses a log scale. This is useful if you are looking at a column of data throughout the atmosphere and the y-axis is pressure.
/home/runner/work/emcpy/emcpy/src/emcpy/plots/create_plots.py:1746: UserWarning: set_ticklabels() should only be used with a fixed number of ticks, i.e. after set_ticks() or using a FixedLocator.
  ax.set_yticklabels(labels, **kwargs)
import numpy as np
import matplotlib.pyplot as plt

from emcpy.plots.plots import LinePlot
from emcpy.plots.create_plots import CreatePlot, CreateFigure


def main():

    x = [0, 401, 1039, 2774, 2408, 512]
    y = [0, 45, 225, 510, 1200, 1820]

    # Create line plot object
    lp = LinePlot(x, y)

    # Create plot object and add features
    plot1 = CreatePlot()
    plot1.plot_layers = [lp]
    plot1.add_title(label='Test Line Plot, Inverted Log Scale')
    plot1.add_xlabel(xlabel='X Axis Label')
    plot1.add_ylabel(ylabel='Y Axis Label')

    # Set y-scale to log and invert
    plot1.set_yscale('log')
    plot1.invert_yaxis()

    # Set new y labels
    ylabels = [0, 50, 100, 500, 1000, 2000]
    plot1.set_yticklabels(labels=ylabels)

    # Create figure
    fig = CreateFigure()
    fig.plot_list = [plot1]
    fig.create_figure()

    plt.show()


if __name__ == '__main__':
    main()
Total running time of the script: (0 minutes 0.081 seconds)