Note
Go to the end to download the full example code.
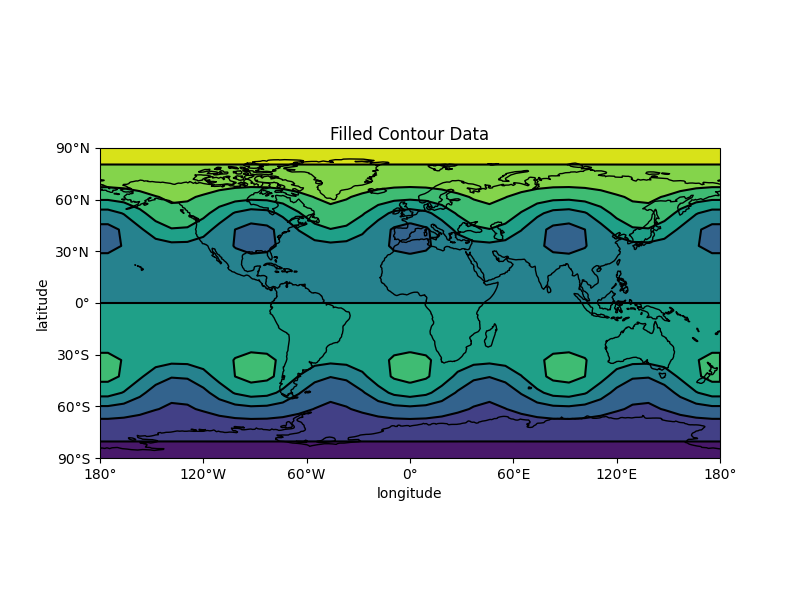
Plotting contours on a map plot#
The below example shows a map with plotted contour lines that are filled.
import numpy as np
import matplotlib.pyplot as plt

from emcpy.plots import CreatePlot, CreateFigure
from emcpy.plots.map_tools import Domain, MapProjection
from emcpy.plots.map_plots import MapContour, MapFilledContour


def _getContourData(shape=(73, 145)):
    # Generate test data for contour plots
    nlats, nlons = shape
    lats = np.linspace(-np.pi / 2, np.pi / 2, nlats)
    lons = np.linspace(0, 2 * np.pi, nlons)
    lons, lats = np.meshgrid(lons, lats)
    wave = 0.75 * (np.sin(2 * lats) ** 8) * np.cos(4 * lons)
    mean = 0.5 * np.cos(2 * lats) * ((np.sin(2 * lats)) ** 2 + 2)

    lats = np.rad2deg(lats)
    lons = np.rad2deg(lons)
    data = wave + mean

    return lats, lons, data


def main():
    # Get created test data
    x, y, z = _getContourData((20, 40))
    z = z * -1.5 * x

    contourf = MapFilledContour(x, y, z)
    contourf.cmap = 'viridis'
    contour = MapContour(x, y, z)

    plot1 = CreatePlot()
    plot1.plot_layers = [contourf, contour]
    plot1.projection = 'plcarr'
    plot1.domain = 'global'
    plot1.add_map_features(['coastline'])
    plot1.add_xlabel(xlabel='longitude')
    plot1.add_ylabel(ylabel='latitude')
    plot1.add_title(label='Filled Contour Data', loc='center')

    fig = CreateFigure()
    fig.plot_list = [plot1]
    fig.create_figure()

    plt.show()


if __name__ == '__main__':

    main()
Total running time of the script: (0 minutes 0.237 seconds)