Note
Go to the end to download the full example code.
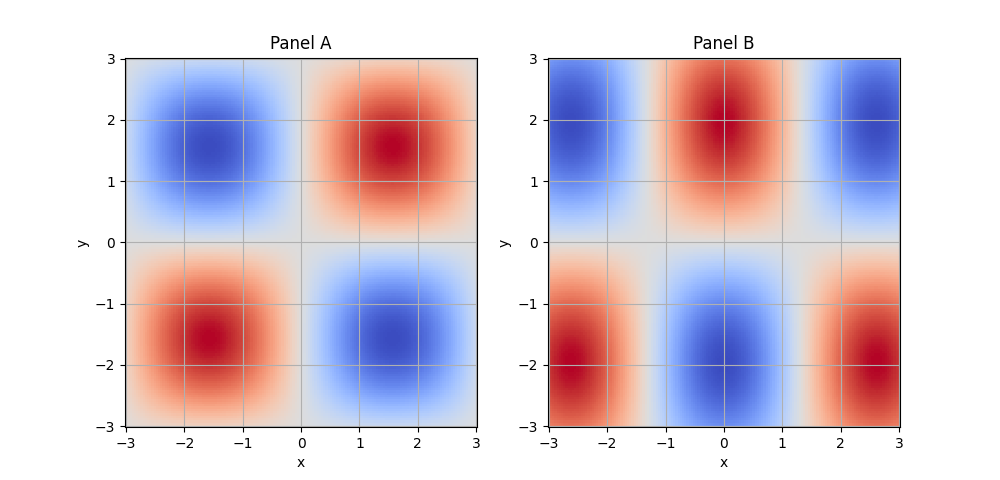
Two panels with one shared colorbar#
Both panels use the same scale; a single horizontal colorbar is placed below the grid using EMCPy’s single_cbar option.
import numpy as np
import matplotlib.pyplot as plt

from emcpy.plots.plots import GriddedPlot
from emcpy.plots.create_plots import CreatePlot, CreateFigure

x = np.linspace(-3, 3, 160)
y = np.linspace(-3, 3, 160)
X, Y = np.meshgrid(x, y)

Z1 = np.sin(X) * np.sin(Y)
Z2 = np.cos(1.2*X) * np.sin(0.8*Y)

vmin, vmax = -1.0, 1.0

left = CreatePlot()
gl = GriddedPlot(X, Y, Z1)
gl.cmap = "coolwarm"
gl.vmin = vmin
gl.vmax = vmax

left.plot_layers = [gl]
left.add_title("Panel A")
left.add_xlabel("x")
left.add_ylabel("y")
left.add_grid()

right = CreatePlot()
gr = GriddedPlot(X, Y, Z2)
gr.cmap = "coolwarm"
gr.vmin = vmin
gr.vmax = vmax

right.plot_layers = [gr]
right.add_title("Panel B")
right.add_xlabel("x")
right.add_ylabel("y")
right.add_grid()

# Ask for a single colorbar (EMCPy will place it under the bottom-right axes)
# You can call this on either/both plots; only the last subplot will draw it.
right.add_colorbar(label="value", single_cbar=True, orientation="horizontal")

fig = CreateFigure(nrows=1, ncols=2, figsize=(10, 4.8))
fig.plot_list = [left, right]
fig.create_figure()
plt.show()
Total running time of the script: (0 minutes 0.140 seconds)