Note
Go to the end to download the full example code.
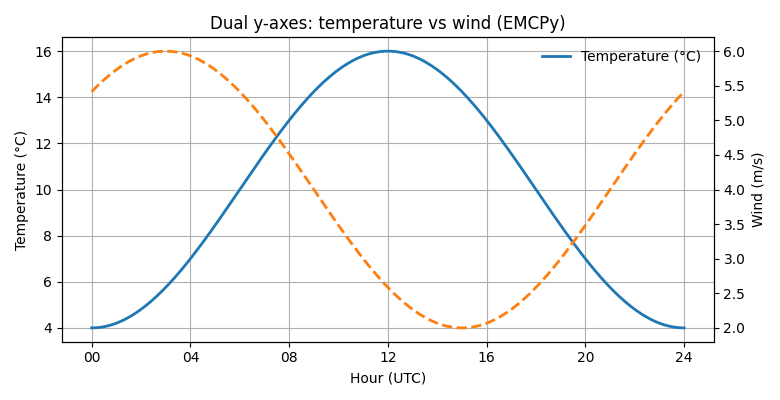
Dual y-axes (twinx)#
Plot two series sharing the same x-axis with a secondary y-axis created via EMCPy’s twinx helpers. No direct Matplotlib calls.
import numpy as np
import matplotlib.pyplot as plt

from emcpy.plots.plots import LinePlot
from emcpy.plots.create_plots import CreatePlot, CreateFigure

x = np.linspace(0, 24, 200)               # hours
temp_c = 10 + 6*np.sin((x-6)/24*2*np.pi)  # °C
wind_ms = 4 + 2*np.cos((x-3)/24*2*np.pi)  # m/s

p = CreatePlot()

# Primary series (left y-axis)
lp1 = LinePlot(x, temp_c)
lp1.linewidth = 2
lp1.color = "tab:blue"
lp1.label = "Temperature (°C)"

# Secondary series (right y-axis) configured via add_twinx
lp2 = LinePlot(x, wind_ms)
lp2.linewidth = 2
lp2.linestyle = "--"
lp2.color = "tab:orange"
lp2.label = "Wind (m/s)"

p.plot_layers = [lp1]
p.add_twinx(lp2)                 # <- enable right axis and attach its layers
p.add_title("Dual y-axes: temperature vs wind (EMCPy)")
p.add_xlabel("Hour (UTC)")
p.add_ylabel("Temperature (°C)")
p.add_twin_ylabel("Wind (m/s)")  # right-axis label

# Optional axis cosmetics (all EMCPy)
p.add_grid()
p.add_legend(loc="upper right", frameon=False)  # legend for the left axis series

# If you want ticks to align nicely across both panels, set them explicitly:
xt = list(np.linspace(0, 24, 7))
p.set_xticks(xt)
p.set_xticklabels([f"{int(v):02d}" for v in xt])

fig = CreateFigure(nrows=1, ncols=1, figsize=(7.8, 4))
fig.plot_list = [p]
fig.create_figure()
fig.tight_layout()
plt.show()
Total running time of the script: (0 minutes 0.115 seconds)