Note
Go to the end to download the full example code.
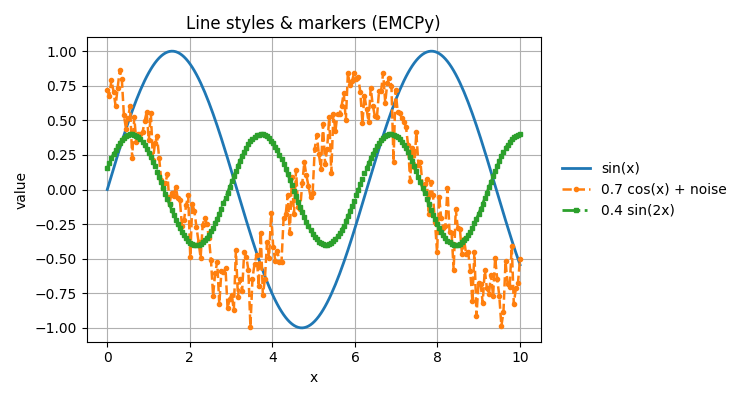
Line styles & legend outside#
Multiple lines with different markers/linestyles and a legend placed outside the axes using EMCPy helpers only.
import numpy as np
import matplotlib.pyplot as plt

from emcpy.plots.plots import LinePlot
from emcpy.plots.create_plots import CreatePlot, CreateFigure

rng = np.random.default_rng(0)
x = np.linspace(0, 10, 200)
y1 = np.sin(x)
y2 = 0.7 * np.cos(x) + 0.15 * rng.standard_normal(x.size)
y3 = 0.4 * np.sin(2*x + 0.4)

plot = CreatePlot()
layers = []

lp = LinePlot(x, y1)
lp.color = "tab:blue"
lp.linestyle = "-"
lp.linewidth = 2
lp.label = "sin(x)"
layers.append(lp)

lp = LinePlot(x, y2)
lp.color = "tab:orange"
lp.linestyle = "--"
lp.linewidth = 1.8
lp.marker = "o"
lp.markersize = 3
lp.label = "0.7 cos(x) + noise"
layers.append(lp)

lp = LinePlot(x, y3)
lp.color = "tab:green"
lp.linestyle = "-."
lp.linewidth = 2
lp.marker = "s"
lp.markersize = 3
lp.label = "0.4 sin(2x)"
layers.append(lp)

plot.plot_layers = layers
plot.add_title("Line styles & markers (EMCPy)")
plot.add_xlabel("x")
plot.add_ylabel("value")
plot.add_grid()
plot.add_legend(loc="center left", bbox_to_anchor=(1.02, 0.5), frameon=False)

fig = CreateFigure(nrows=1, ncols=1, figsize=(7.5, 4))
fig.plot_list = [plot]
fig.create_figure()
fig.tight_layout()
plt.show()
Total running time of the script: (0 minutes 0.092 seconds)