Note
Go to the end to download the full example code.
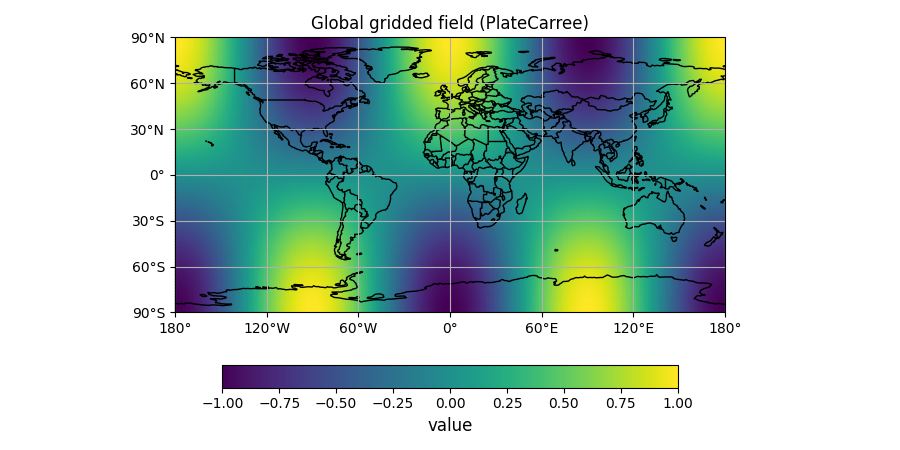
Global gridded (PlateCarree) with coastlines#
A simple global pcolormesh with a per-axes colorbar.
import numpy as np
import matplotlib.pyplot as plt

from emcpy.plots.map_plots import MapGridded
from emcpy.plots.create_plots import CreatePlot, CreateFigure

# Build a lon/lat grid and a synthetic field
lons = np.linspace(-180, 180, 361)
lats = np.linspace(-90, 90, 181)
LON, LAT = np.meshgrid(lons, lats)
Z = np.sin(np.radians(LAT)) * np.cos(2 * np.radians(LON))

p = CreatePlot(projection="plcarr", domain="global")  # PlateCarree + global domain
mg = MapGridded(LAT, LON, Z)
mg.cmap = "viridis"
p.plot_layers = [mg]

p.add_title("Global gridded field (PlateCarree)")
p.add_map_features(["coastline", "borders"])
p.add_colorbar(label="value")
p.add_grid()

fig = CreateFigure(nrows=1, ncols=1, figsize=(9, 4.5))
fig.plot_list = [p]
fig.create_figure()
fig.tight_layout()
plt.show()
Total running time of the script: (0 minutes 1.138 seconds)