Note
Go to the end to download the full example code.
Pcolormesh#
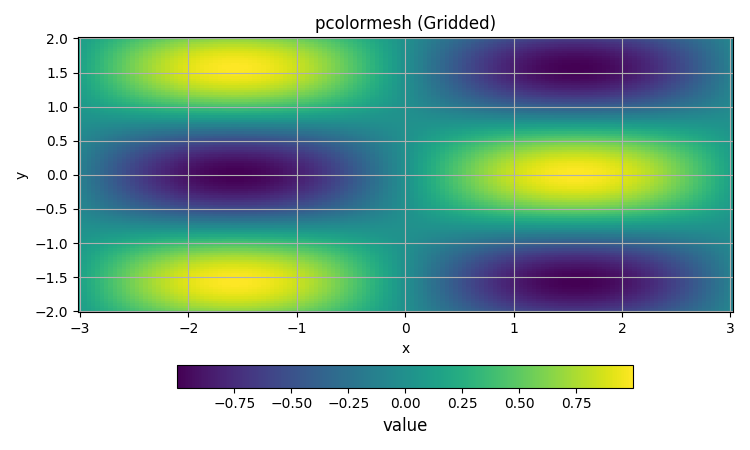
Basic gridded heatmap with a per-axes colorbar.
import numpy as np
import matplotlib.pyplot as plt

from emcpy.plots.plots import GriddedPlot
from emcpy.plots.create_plots import CreatePlot, CreateFigure

x = np.linspace(-3, 3, 150)
y = np.linspace(-2, 2, 120)
X, Y = np.meshgrid(x, y)
Z = np.sin(X) * np.cos(2 * Y)

p = CreatePlot()
g = GriddedPlot(X, Y, Z)
g.cmap = "viridis"
p.plot_layers = [g]

p.add_title("pcolormesh (Gridded)")
p.add_xlabel("x")
p.add_ylabel("y")
p.add_grid()
p.add_colorbar(label="value")

fig = CreateFigure(nrows=1, ncols=1, figsize=(7.5, 4.5))
fig.plot_list = [p]
fig.create_figure()
fig.tight_layout()
plt.show()
Total running time of the script: (0 minutes 0.122 seconds)