Ctrl+K

EMCPy

  • Get started
  • Explanations
  • Contributing
  • Plot Types
  • Examples
  • GitHub
  • Get started
  • Explanations
  • Contributing
  • Plot Types
  • Examples
  • GitHub

Section Navigation

  • Basic
    • Bar Plot
    • Error Bars
    • Fill Between
    • Horizontal Bar Plot
    • Horizontal Line Plot
    • Line Plot
    • Scatter Plot
    • Vertical Line Plot
  • Statistical distributions
    • Box Plot
    • Density
    • Density Scatter Plot
    • HexBin
    • 2D Histogram
    • Histogram
    • Violin Plot
  • Gridded
    • Contour
    • Filled Contour
    • Gridded
  • Map Plots
    • Gridded Map Plot
    • Scatter Map Plot
    • 2D Scatter Map Plot
  • Plot Types
  • Basic

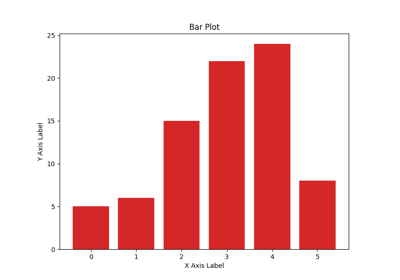
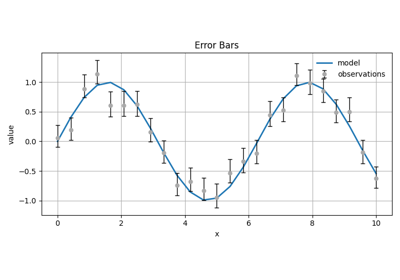
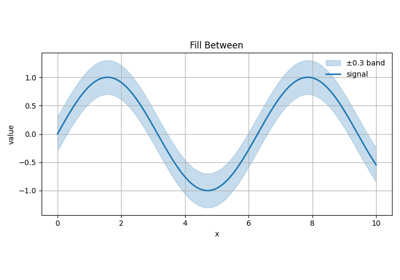
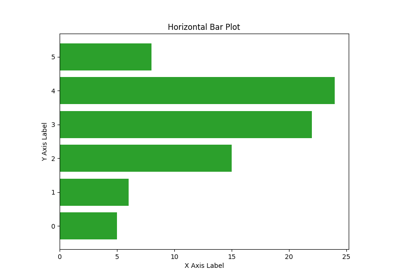
Basic#

Bar Plot

Bar Plot

Error Bars

Error Bars

Fill Between

Fill Between

Horizontal Bar Plot

Horizontal Bar Plot

Horizontal Line Plot

Horizontal Line Plot

Line Plot

Line Plot

Scatter Plot

Scatter Plot

Vertical Line Plot

Vertical Line Plot

This Page

  • Show Source

© Copyright 2025, NOAA/EMC.

Built with the PyData Sphinx Theme 0.16.1.