Note
Go to the end to download the full example code.
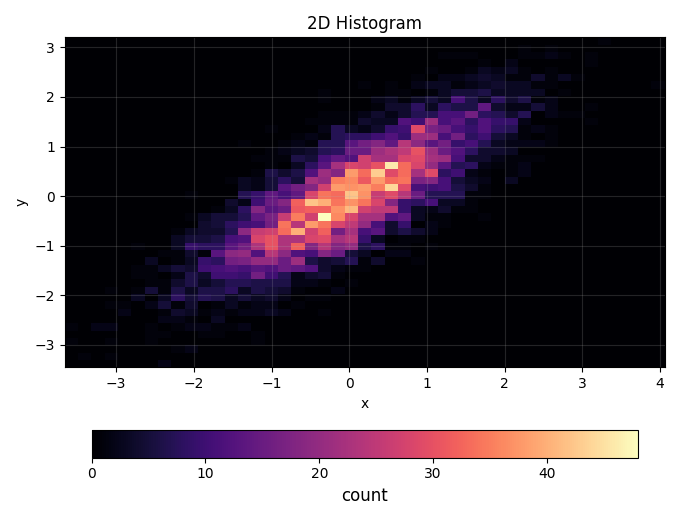
2D Histogram#
Bivariate histogram using Hist2D with a colorbar.
import numpy as np

from emcpy.plots.plots import Hist2D
from emcpy.plots.create_plots import CreatePlot, CreateFigure

rng = np.random.default_rng(7)
x = rng.normal(size=6000)
y = 0.8 * x + rng.normal(scale=0.6, size=x.size)

p = CreatePlot()
layers = []

h2 = Hist2D(x, y)
h2.bins = (45, 45)
h2.cmap = "magma"
layers.append(h2)

p.plot_layers = layers
p.add_title("2D Histogram")
p.add_xlabel("x")
p.add_ylabel("y")
p.add_grid(alpha=0.2)
p.add_colorbar(label="count")

fig = CreateFigure(1, 1, figsize=(6.8, 5.2))
fig.plot_list = [p]
fig.create_figure()
fig.tight_layout()
Total running time of the script: (0 minutes 0.100 seconds)