Note
Go to the end to download the full example code.
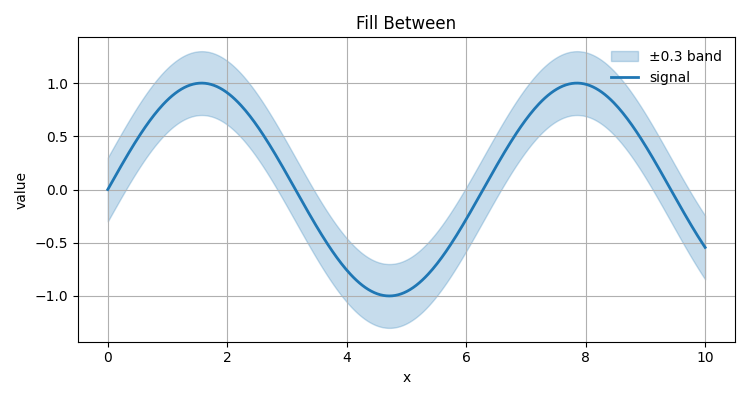
Fill Between#
A shaded band between two curves using the FillBetween layer.
import numpy as np

from emcpy.plots.plots import LinePlot, FillBetween
from emcpy.plots.create_plots import CreatePlot, CreateFigure

x = np.linspace(0, 10, 400)
y = np.sin(x)
band = 0.3

p = CreatePlot()
layers = []

fb = FillBetween(x, y - band, y + band)
fb.alpha = 0.25
fb.label = "±0.3 band"
layers.append(fb)

lp = LinePlot(x, y)
lp.linewidth = 2
lp.label = "signal"
layers.append(lp)

p.plot_layers = layers
p.add_title("Fill Between")
p.add_xlabel("x")
p.add_ylabel("value")
p.add_grid()
p.add_legend(loc="upper right", frameon=False)

fig = CreateFigure(1, 1, figsize=(7.5, 4))
fig.plot_list = [p]
fig.create_figure()
fig.tight_layout()
Total running time of the script: (0 minutes 0.074 seconds)