Note
Go to the end to download the full example code.
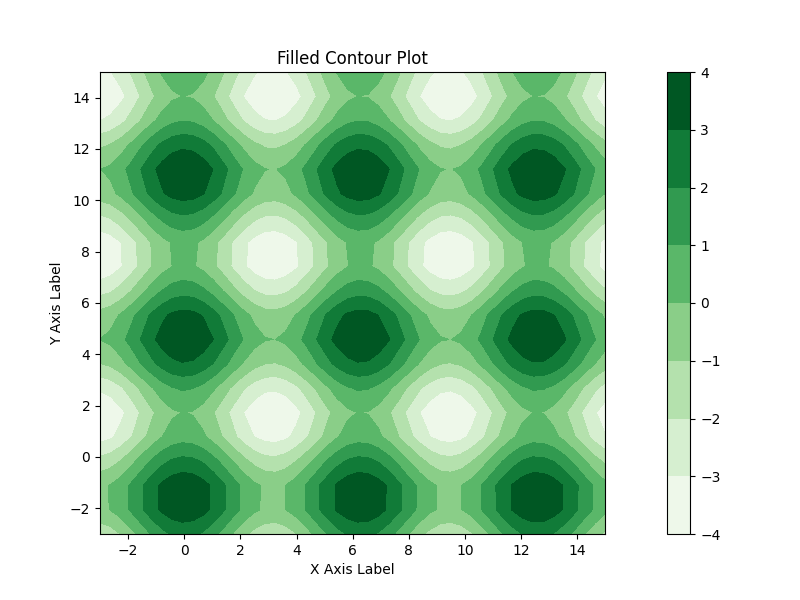
Filled Contour#
Below is an example of how to plot a filled contour plot using EMCPy’s plotting method.
import numpy as np
import matplotlib.pyplot as plt

from emcpy.plots.plots import FilledContourPlot
from emcpy.plots.create_plots import CreatePlot, CreateFigure


def main():
    # Create contourf plot

    # Grab sample data
    x, y, z = _getContourfData()

    # Create filled contour plot object
    cfp = FilledContourPlot(x, y, z)
    cfp.cmap = 'Greens'

    # Create plot and add features
    plot1 = CreatePlot()
    plot1.plot_layers = [cfp]
    plot1.add_xlabel(xlabel='X Axis Label')
    plot1.add_ylabel(ylabel='Y Axis Label')
    plot1.add_title('Filled Contour Plot')
    plot1.add_colorbar(orientation='vertical')

    # Create figure
    fig = CreateFigure()
    fig.plot_list = [plot1]
    fig.create_figure()

    plt.show()


def _getContourfData():
    # Generate test data for contourf plots

    x = np.linspace(-3, 15, 50).reshape(1, -1)
    y = np.linspace(-3, 15, 20).reshape(-1, 1)
    z = np.cos(x)*2 - np.sin(y)*2

    x, y = x.flatten(), y.flatten()

    return x, y, z


if __name__ == '__main__':
    main()
Total running time of the script: (0 minutes 0.082 seconds)