Note
Go to the end to download the full example code.
Heatmap#
Below is an example of how to plot a categorical heatmap using EMCPy’s plotting method.
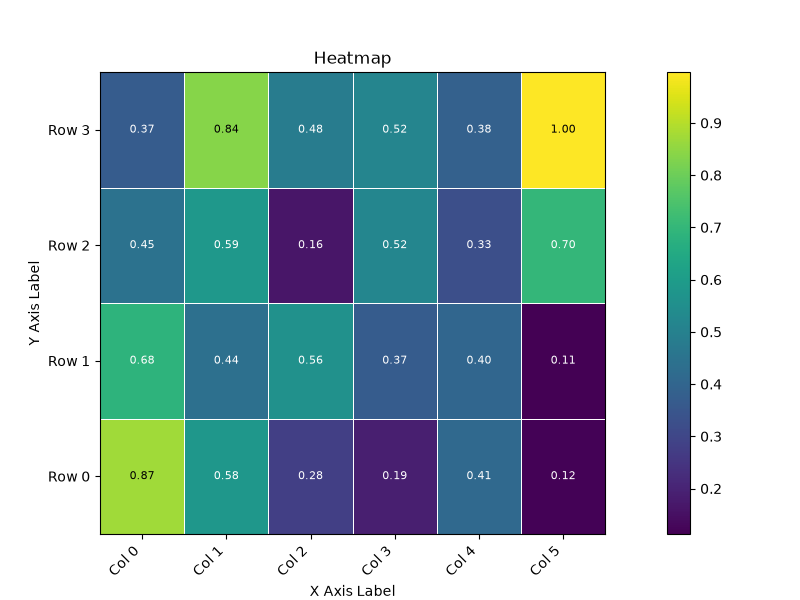
import numpy as np
import matplotlib.pyplot as plt

from emcpy.plots.plots import HeatMap
from emcpy.plots.create_plots import CreatePlot, CreateFigure


def main():
    # Create heatmap plot

    # Grab sample data
    x, y, data = _getHeatmapData()

    # Create heatmap object
    hm = HeatMap(x, y, data)
    hm.cmap = 'viridis'

    # Create plot object and add features
    plot1 = CreatePlot()
    plot1.plot_layers = [hm]
    plot1.add_xlabel(xlabel='X Axis Label')
    plot1.add_ylabel(ylabel='Y Axis Label')
    plot1.add_title('Heatmap')
    plot1.add_colorbar(orientation='vertical')

    # Create figure
    fig = CreateFigure()
    fig.plot_list = [plot1]
    fig.create_figure()

    plt.show()


def _getHeatmapData():
    # Generate test data for heatmap

    x = [f'Col {i}' for i in range(6)]
    y = [f'Row {i}' for i in range(4)]
    r = np.random.RandomState(25)
    data = r.random_sample([len(y), len(x)])

    return x, y, data


if __name__ == '__main__':
    main()
Total running time of the script: (0 minutes 0.120 seconds)