Note
Go to the end to download the full example code.
Heatmap#
Categorical heatmap with a diverging colormap, cell annotations, and missing-data masking.
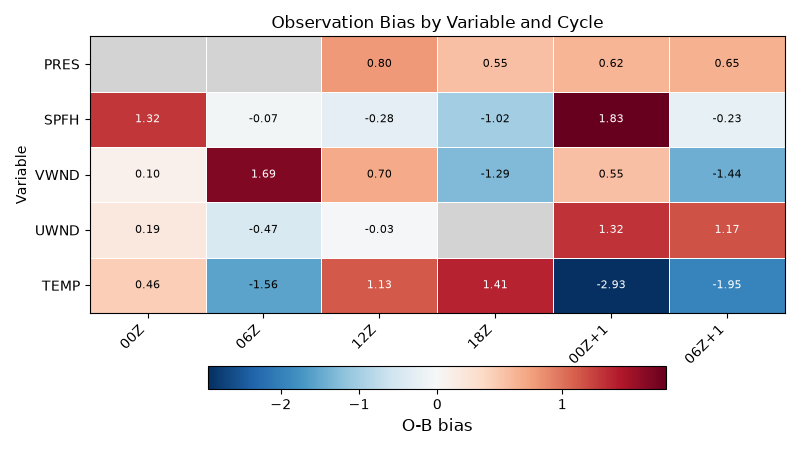
import numpy as np
import matplotlib.pyplot as plt

from emcpy.plots.plots import HeatMap
from emcpy.plots.create_plots import CreatePlot, CreateFigure

cycles = ["00Z", "06Z", "12Z", "18Z", "00Z+1", "06Z+1"]
variables = ["TEMP", "UWND", "VWND", "SPFH", "PRES"]

rng = np.random.default_rng(42)
data = rng.normal(0, 1.5, size=(len(variables), len(cycles)))
data[1, 3] = np.nan   # simulate a missing/quarantined cycle
data[4, :2] = np.nan  # variable not yet reporting at start of window

p = CreatePlot()
hm = HeatMap(cycles, variables, data)
hm.cmap = "RdBu_r"
hm.center = 0.0
hm.annotate = True
hm.annotate_fmt = "{:.2f}"
hm.mask_color = "lightgray"
p.plot_layers = [hm]

p.add_title("Observation Bias by Variable and Cycle")
p.add_xlabel("Cycle")
p.add_ylabel("Variable")
p.add_colorbar(label="O-B bias")

fig = CreateFigure(nrows=1, ncols=1, figsize=(8, 4.5))
fig.plot_list = [p]
fig.create_figure()
fig.tight_layout()
plt.show()
Total running time of the script: (0 minutes 0.166 seconds)